Quickstart.md
-
Jorge Aparicio authoredJorge Aparicio authored

- Quickstart: a template for Cortex-M development
- Abstraction layers
- Dependencies for development
- Linux
- macOS
- Windows
- All
- Demo
- Creating a new project
- Hello world
- Build and analyze
- Flash and debug
- Device specific program
- Bonus: setting a default target
- Transitioning to Visual Code Studio
- Formatting
- Build task
- Debugging
Quickstart: a template for Cortex-M development
Abstraction layers

-
cortex-mis a crate that provides an API to use functionality common to all Cortex-M microcontrollers. -
stm32f30xis a device crate. It provides an API to access the hardware of a device. This crate is automatically generated from a SVD file and provides a low level API to manipulate registers.
-
f3is a board support crate. It provides a higher level API (Serial,I2C, etc.) tailored to a specific development board. -
cortex-m-rtis a minimal "runtime" that handles initialization of RAM and provides the default exception handling behavior. It is also gives your program the required memory layout. -
???is a concurrency framework that we'll introduce in a later lecture.
Dependencies for development
-
arm-none-eabi-binutils, linker -
arm-none-eabi-gdb, debugger -
openocd, for flashing / debugging the device -
xargo, for compiling thecorecrate. Xargo is a Cargo wrapper -- it has the exact same UI. Xargo takes care of building thecorecrate and linking it to your program / library. -
And other handy Cargo subcommands
Linux
- Arch Linux
$ sudo pacman -Sy arm-none-eabi-{binutils,gdb} openocdFor hardware-association and pre-packaged UDEV-rules also install:
$ sudo pacman -S stlinkmacOS
$ brew cask install gcc-arm-embedded
$ brew install openocd
If the brew cask command doesn't work (Error: Unknown command: cask), then run brew tap Caskroom/tap first and try again.
Windows
Installers below
-
OpenOCD. Unzip to your C (system) drive
All
$ # we have to use the nightly channel for embedded development
$ rustup default nightly

$ cargo install cargo-clone xargo
NOTE If the
cargo installfails you may need to installpkg-config. In Arch this can be accomplished with thepacman -S pkg-configcommand.
Demo
In the first part of the demo we'll use command line tools in the terminal then we'll transition to the Visual Studio Code IDE. It's a good idea to get familiar with the command line tools. The IDE is nice because it calls these tools with the right arguments for you but when things go south it pays off to understand what the IDE is doing under the hood.
Creating a new project
These steps will give you a minimal Cortex-M project. If you run into any problem running these commands check out the troubleshooting guide.
$ # fetch the Cargo project template
$ cargo clone cortex-m-quickstart

$ # rename it as you wish (remember this name! you'll use it later)
$ mv cortex-m-quickstart app

$ cd app

$ # Cargo.toml.orig has a nicer format so let's use that instead of the reformatted one
$ mv Cargo.toml{.orig,}

$ # update the crate name and author
$ $EDITOR Cargo.toml
$ cat Cargo.toml
[package]
authors = ["Jorge Aparicio <jorge@japaric.io>"]
name = "app"
version = "0.1.0"

[dependencies]
cortex-m = "0.3.0"
cortex-m-semihosting = "0.2.0"

[dependencies.cortex-m-rt]
features = ["abort-on-panic"]
version = "0.3.3"

[profile.release]
debug = true
lto = true

$ # we need to specify the memory layout of the device
$ $EDITOR memory.x

$ # for the blue-pill you should have
$ cat memory.x
MEMORY
{
  /* NOTE K = KiBi = 1024 bytes */
  FLASH : ORIGIN = 0x08000000, LENGTH = 64K
  RAM : ORIGIN = 0x20000000, LENGTH = 20K
}

$ # for the NUCLEO-F401RE you should have
$ cat memory.x
{
  /* NOTE K = KiBi = 1024 bytes */
  FLASH : ORIGIN = 0x08000000, LENGTH = 512K
  RAM : ORIGIN = 0x20000000, LENGTH = 96K
}
Hello world
Let's start with the hello world example:
$ rm -rf src
$ mkdir src
$ cp examples/hello.rs src/main.rs
This is the hello world program. You can ignore the INTERRUPTS + default_handler part -- that's
a generic interrupt table that we'll remove later.
#![feature(used)]
#![no_std]

extern crate cortex_m;
extern crate cortex_m_rt;
extern crate cortex_m_semihosting;

use core::fmt::Write;

use cortex_m::asm;
use cortex_m_semihosting::hio;

fn main() {
    // get a handle to the *host* standard output
    let mut stdout = hio::hstdout().unwrap();

    // write "Hello, world!" to it
    writeln!(stdout, "Hello, world!").unwrap();
}

// As we are not using interrupts, we just register a dummy catch all handler
#[link_section = ".vector_table.interrupts"]
#[used]
static INTERRUPTS: [extern "C" fn(); 240] = [default_handler; 240];

extern "C" fn default_handler() {
    asm::bkpt();
}
The new thing here is the #![no_std] attribute. This indicates that this program will not link
to the std, standard, crate. Instead it will link to the core crate. The core crate is a
subset of the std crate that has no dependencies to OS mechanisms like threads, dynamic memory
allocation, sockets, etc. core provides the minimal amount of support to run Rust on a bare metal
system.
Build and analyze
Let's build this:
$ # NOTE use `thumbv7m-none-eabi` for the blue-pill, and `thumbv7em-none-eabihf` for the nucleo
$ xargo build --target thumbv7m-none-eabi
The
thumbv7m-none-eabitarget corresponds to the Cortex-M3 architecture. Thethumbv7em-none-eabihftarget corresponds to the Cortex-M4F architecture -- note the "F": this means that the architecture has hardware support for floating point operations).
This produces an unoptimized binary.
$ # mind the target name (use thumbv7em-none-eabihf for the nucleo)
$ arm-none-eabi-size target/thumbv7m-none-eabi/debug/app
   text    data     bss     dec     hex filename
  14596       0       0   14596    3904 target/thumbv7m-none-eabi/debug/app
Let's rebuild in release mode. To avoid repeating myself I'll create a $TARGET variable that
contains the name of the target.
$ TARGET=thumbv7m-none-eabi

$ xargo build --target $TARGET --release
Now the binary is much smaller.
$ arm-none-eabi-size target/$TARGET/release/app
   text    data     bss     dec     hex filename
   3646       0       0    3646     e3e target/thumbv7m-none-eabi/release/app
You can get a breakdown of the memory usage by passing the -Ax flag:
$ arm-none-eabi-size -Ax target/$TARGET/debug/app
section                 size         addr
.vector_table          0x400    0x8000000
.text                 0x27f8    0x8000400
.rodata                0xd0c    0x8002c00
.bss                     0x0   0x20000000
.data                    0x0   0x20000000
.bss and .data are statically allocated (static) variables; there are none in this program.
.text holds the program code. .rodata are constants, usually you'll find strings like our
"Hello, world!" in this section. .vector_table is a region of memory that holds the vector table.
Exercise Do you remember the start address of the Flash memory and RAM? (hint: memory.x) Which sections are located in Flash memory? Which sections are located in RAM?
Another interesting thing to do here is to look at the disassembly of the program:
$ arm-none-eabi-objdump -CD target/$TARGET/release/app
Disassembly of section .vector_table:

08000000 <_svector_table>:
 8000000:       20005000        andcs   r5, r0, r0

08000004 <cortex_m_rt::RESET_VECTOR>:
 8000004:       08000401        stmdaeq r0, {r0, sl}

08000008 <EXCEPTIONS>:
 8000008:       08000639        stmdaeq r0, {r0, r3, r4, r5, r9, sl}
 (..)

Disassembly of section .text:

08000400 <cortex_m_rt::reset_handler>:
 8000400:       b580            push    {r7, lr}
 8000402:       466f            mov     r7, sp
 8000404:       b088            sub     sp, #32
 8000406:       f240 0000       movw    r0, #0
 800040a:       f240 0100       movw    r1, #0
 800040e:       f2c2 0000       movt    r0, #8192       ; 0x2000
 8000412:       f2c2 0100       movt    r1, #8192       ; 0x2000
 8000416:       4281            cmp     r1, r0
 (..)

08000638 <BUS_FAULT>:
 8000638:       f3ef 8008       mrs     r0, MSP
 800063c:       f7ff bffa       b.w     8000634 <cortex_m_rt::default_handler>
 (..)

Disassembly of section .rodata:

08000d44 <vtable.8>:
 8000d44:       080004cb        stmdaeq r0, {r0, r1, r3, r6, r7, sl}
 8000d48:       00000004        andeq   r0, r0, r4
 8000d4c:       00000004        andeq   r0, r0, r4
 8000d50:       080005e9        stmdaeq r0, {r0, r3, r5, r6, r7, r8, sl}
 (..)
Exercise Compare the contents of the
.vector_tablelinker section, see above (or look at your local output), to the diagram of the vector table in the ARM documentation. What are the values of the "Initial SP value", "Reset", "NMI", "Hard fault" entries according to the disassembly? What do these values mean? Investigate how these values are used in the boot process and the exception handling mechanism.
If you are curious about how the program ended with this particular memory layout look at the linker
scripts in the target directory -- these scripts instruct the linker where to place things.
$ # list of linker scripts
$ find target -name '*.x'
target/thumbv7m-none-eabi/release/build/app-4c6a87e0e5f739ae/out/memory.x
target/thumbv7m-none-eabi/release/build/cortex-m-rt-4f13cf879b7980df/out/link.x
You can also visualize the exact linker command rustc used to link the binary by running the
following command:
$ xargo rustc --target $TARGET --release -- -Z print-link-args
"arm-none-eabi-ld" "-L" (..)
Flash and debug
To flash the program into the microcontroller we must first connect the device to our laptop. If you are using a NUCLEO-F401RE you only to connect a USB cable. If you are using the blue-pill you'll have to connect a external SWD programmer. The pinout of the blue-pill is shown below ; you'll have to at least connect the GND, SWDIO and SWCLK pins. If you want to power the blue-pill using the SWD programmer then also connect the 3V3 or the 5V pin.

Then we have to start OpenOCD. OpenOCD will connect to the SWD programmer (the NUCLEO-F401RE board has a built-in one) and start a GDB server.
$ # for the blue-pill
$ openocd -f interface/stlink-v2.cfg -f target/stm32f1x.cfg

$ # for the NUCLE-F401RE
$ openocd -f interface/stlink-v2-1.cfg -f target/stm32f4x.cfg
NOTE(Linux) If you get a permission error when running OpenOCD then you'll need to change the udev rules for the SWD programmer you are using. To do that create the following file at
/etc/udev/rules.d.$ cat /etc/udev/rules.d/99-st-link.rules # ST-LINK v2 SUBSYSTEMS=="usb", ATTRS{idVendor}=="0483", ATTRS{idProduct}=="3748", MODE:="0666" # ST-LINK v2-1 SUBSYSTEMS=="usb", ATTRS{idVendor}=="0483", ATTRS{idProduct}=="374b", MODE:="0666" # NUCLEO-F401RE SUBSYSTEMS=="usb", ATTRS{idVendor}=="0483", ATTRS{idProduct}=="374b", MODE:="0666"With that file in place call the command
sudo udevadm control --reload-rules. Then unplug and re-plug your SWD programmer. That should fix the permission problem.
You should see some output like this:
Open On-Chip Debugger 0.10.0
Licensed under GNU GPL v2
For bug reports, read
        http://openocd.org/doc/doxygen/bugs.html
Info : auto-selecting first available session transport "hla_swd". To override use 'transport select <transport>'.
Info : The selected transport took over low-level target control. The results might differ compared to plain JTAG/SWD
adapter speed: 2000 kHz
adapter_nsrst_delay: 100
none separate
Info : Unable to match requested speed 2000 kHz, using 1800 kHz
Info : Unable to match requested speed 2000 kHz, using 1800 kHz
Info : clock speed 1800 kHz
Info : STLINK v2 JTAG v27 API v2 SWIM v15 VID 0x0483 PID 0x374B
Info : using stlink api v2
Info : Target voltage: 3.268993
Info : stm32f4x.cpu: hardware has 6 breakpoints, 4 watchpoints
You should definitively get the last line -- maybe with some different numbers -- if you don't that indicates a problem: it could be a connection problem, or you could have used the wrong configuration file.
The program will block. That's OK. Leave it running.
Apart from the GDB server OpenOCD also starts a telnet server. You can connect to this server and issue commands to the SWD programmer.
$ telnet localhost 4444

> # this is the telnet propmt

> # the following command will reset the microcontroller and halt the processor

> reset halt
adapter speed: 1800 kHz
target halted due to debug-request, current mode: Thread
xPSR: 0x01000000 pc: 0x08000188 msp: 0x20018000

> exit
The documentation of these commands is here.
With OpenOCD working now we can flash and debug the program using GDB.
$ # enable .gdbinit files
$ echo 'add-auto-load-safe-path /' >> ~/.gdbinit

$ arm-none-eabi-gdb target/$TARGET/debug/app

(gdb) # this is the GDB shell
The processor will be halted at the entry point. You can print the source code that the processor is
about to execute using the list command:
(gdb) # source code
(gdb) list
331     ///
332     /// This is the entry point of all programs
333     #[cfg(target_arch = "arm")]
334     #[link_section = ".reset_handler"]
335     unsafe extern "C" fn reset_handler() -> ! {
336         r0::zero_bss(&mut _sbss, &mut _ebss);
337         r0::init_data(&mut _sdata, &mut _edata, &_sidata);
338
339         match () {
340             #[cfg(not(has_fpu))]
And you can print the machine code that the processor is about to execute using the disassemble
command.
(gdb) disassemble
Dump of assembler code for function cortex_m_rt::reset_handler:
   0x08000130 <+0>:     push    {r7, lr}
   0x08000132 <+2>:     mov     r7, sp
   0x08000134 <+4>:     sub     sp, #32
=> 0x08000136 <+6>:     movw    r0, #0
   0x0800013a <+10>:    movw    r1, #0
   0x0800013e <+14>:    movt    r0, #8192       ; 0x2000
   0x08000142 <+18>:    movt    r1, #8192       ; 0x2000
We can skip to our program main by creating a breakpoint and then calling continue.
(gdb) break app::main
Breakpoint 1 at 0x800045c: file src/main.rs, line 18.

(gdb) continue
Continuing.
Note: automatically using hardware breakpoints for read-only addresses.

Breakpoint 1, app::main () at src/main.rs:18
18          let mut stdout = hio::hstdout().unwrap();
We are now in main we can execute each line of code in this function be repeatedly calling the
next command.
(gdb) next
19          writeln!(stdout, "Hello, world!").unwrap();

(gdb) next
20      }
After executing writeln! you should see "Hello, world!" printed on the OpenOCD console.
$ openocd -f interface/stlink-v2.cfg -f target/stm32f1x.cfg
(..)
Info : halted: PC: 0x08000aee
Hello, world!
Info : halted: PC: 0x0800049c
(..)
One more thing we can do here is to reset the microcontroller using the monitor command. monitor
will forward the command to the telnet server.
(gdb) monitor reset halt
target halted due to debug-request, current mode: Thread
xPSR: 0x01000000 pc: 0x08000400 msp: 0x20005000, semihosting
This is the same command we ran before from the telnet prompt.
Tip: You can get list of all the GDB commands by entering help all in the GDB prompt.
Note that semihosting is very slow. Each write operation takes hundreds of milliseconds; the processor will be in a halted state for the duration of the write operation. Semihosting is nice because it requires no extra wiring or stream but it's only appropriate for simple programs where timing is not a concern.
Device specific program
Let's replace that weird INTERRUPTS + default_handler with something proper. Change
src/main.rs to:
#![no_std]

extern crate cortex_m_semihosting;
extern crate stm32f103xx; // heads up! use `stm32f40x` for the NUCLEO-401RE

use core::fmt::Write;

use cortex_m_semihosting::hio;

fn main() {
    // get a handle to the *host* standard output
    let mut stdout = hio::hstdout().unwrap();

    // write "Hello, world!" to it
    writeln!(stdout, "Hello, world!").unwrap();
}
What we have done here is replace the generic vector table with one tailored for the device we
are targeting. Note that cortex-m-rt is gone; that crate is now provided by the device crate.
Before we can compile this we have to tell Cargo where to get the device crate from. This info goes in the Cargo.toml file:
$ $EDITOR Cargo.toml

$ cat Cargo.toml
# ..

# for the blue-pill (NOTE use this dependency or the other but not both)
[dependencies.stm32f103xx]
features = ["rt"] # this feature indicates that the device crate will provide the vector table
version = "0.7.5"

# for the blue-pill (NOTE use this dependency or the other but not both)
[dependencies.stm32f40x]
features = ["rt"] # see comment above
git = "https://gitlab.henriktjader.com/pln/STM32F40x"

# ..
You should now be able to compile the program again.
$ xargo build --target $TARGET --release

$ arm-none-eabi-size -Ax target/$TARGET/release/app
section                size         addr
.vector_table         0x130    0x8000000
.text                 0x944    0x8000130
.rodata                0xfc    0x8000a74
.bss                    0x0   0x20000000
.data                   0x0   0x20000000
If you are careful observer you probably have noticed that the .vector_table is now smaller.
All the interrupts of a device are listed in the vector table and each device has a different number
of interrupts thus the size of the vector table will vary according to the device.
In the original program we were using a "generic" vector table that assumed that the device had 240 interrupts -- that's the maximum number of interrupts a device can have but devices usually have way less interrupts.
Bonus: setting a default target
So far we have always been calling Xargo with the --target flag. We can skip that by setting a
default target in .cargo/config.
$ cat >>.cargo/config <<EOF
[build]
target = "$TARGET"
EOF
Now you can build your program by simply calling xargo build or xargo build --release.
Transitioning to Visual Code Studio
NOTE Here I assume that you have already installed the vscode-rust plugin.
First some cleanup:
-
Terminate any open GDB clients connected to the OpenOCD GDB server.
-
Remove, or rename, the local
.gdbinitfile.
Now open the app folder with VSCode.
$ code .Formatting
You can enable format on save by adding "editor.formatOnSave": true to the User settings which you
can open hitting Ctrl + ,
Build task
You make the build task work with Cortex-M projects you'll have to tweak the default build task.
Pick from the menu: Tasks > Configure Tasks... then pick Rust: cargo build. In tasks.json
write:
{
    "version": "2.0.0",
    "tasks": [
        {
            "type": "shell",
            "taskName": "xargo build",
            "command": "xargo",
            "args": [
                "build"
            ],
            "problemMatcher": [
                "$rustc"
            ]
        }
    ]
}
Now pick from the menu: Tasks > Configure Default Build Task... and pick xargo build.
Now you should be able to build your project by picking Tasks > Run Build Task... from the menu or
by hitting the shorcut Ctrl + Shift + B.

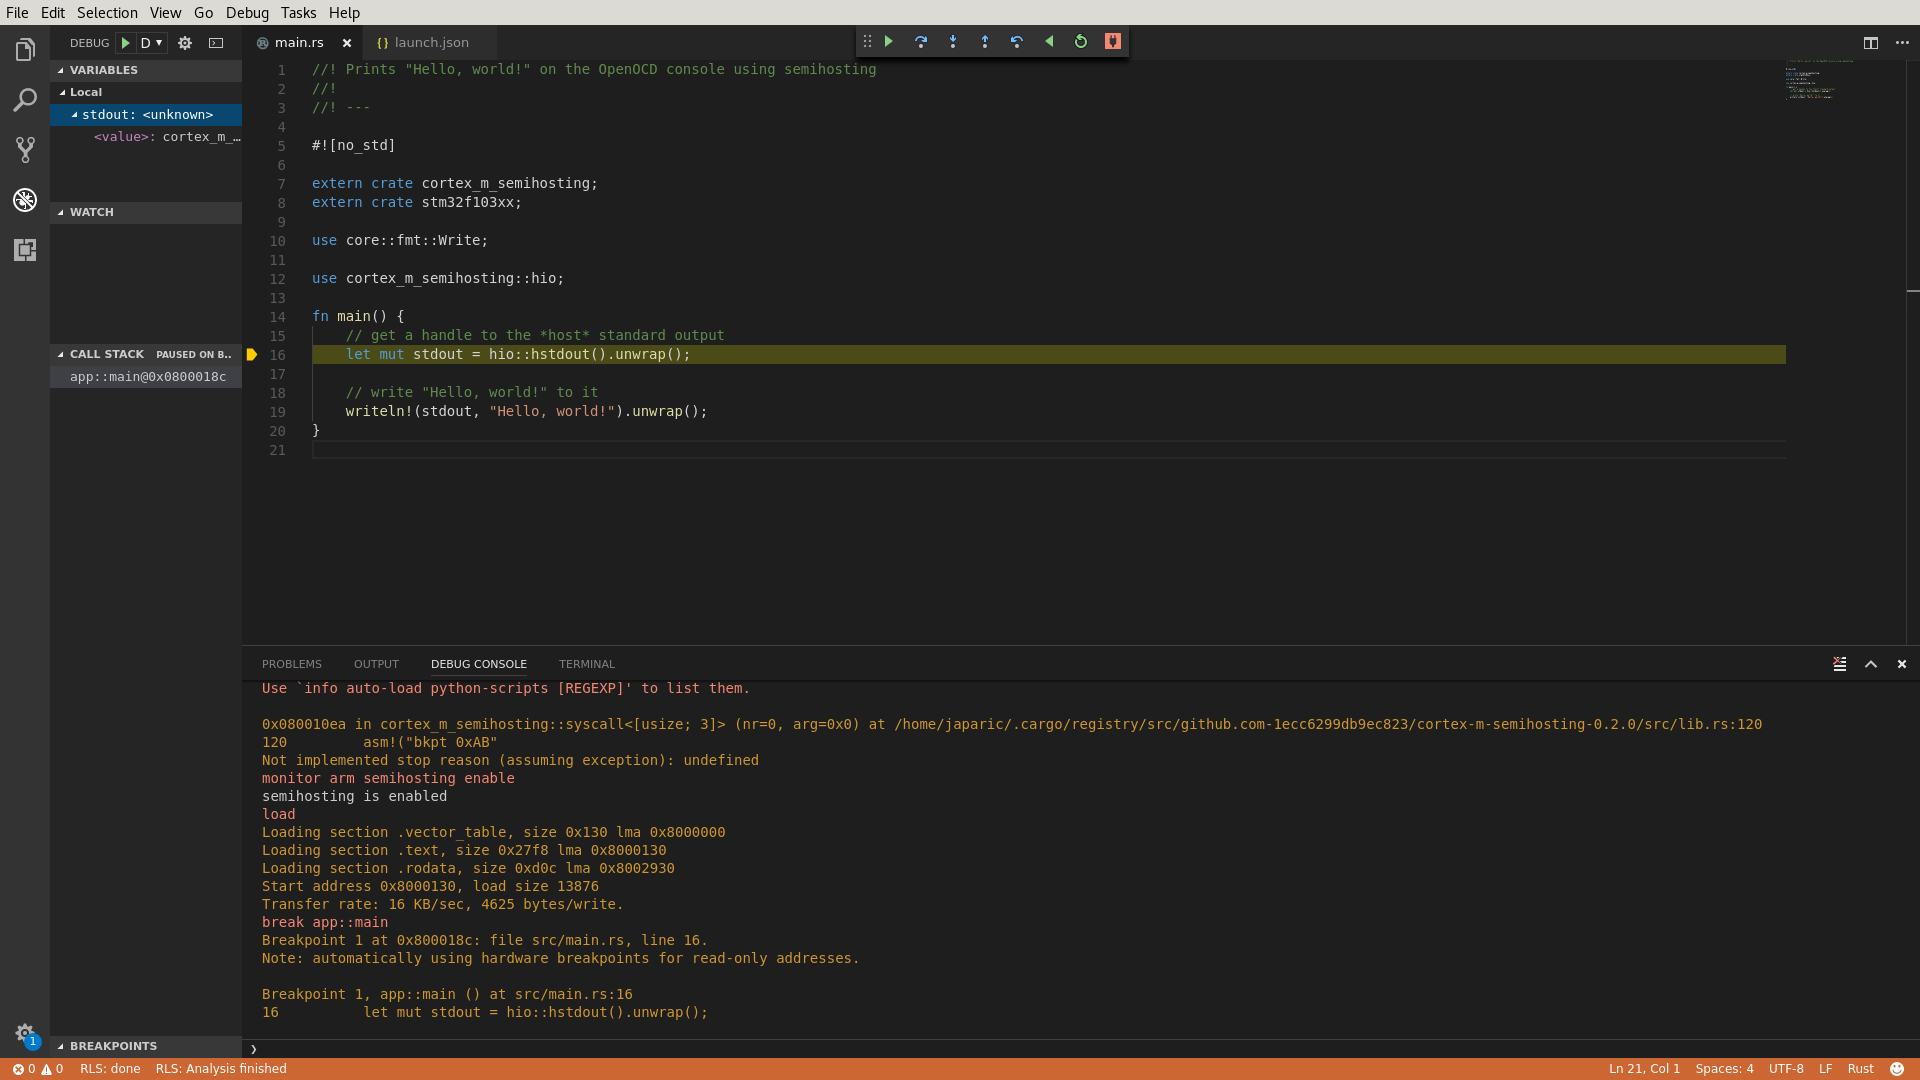
Debugging
You'll need to configure Native Debug to work with embedded projects. Pick Debug > Open Configurations from the menu, pick GDB from the drop down menu and then write this into
launch.json.
{
    "configurations": [
        {
            "autorun": [
                "monitor arm semihosting enable",
                "load",
                "break app::main" // Heads up: crate name
            ],
            "cwd": "${workspaceRoot}",
            "gdbpath": "arm-none-eabi-gdb",
            "executable": "./target/thumbv7m-none-eabi/debug/app", // Heads up: target name
            "name": "Debug",
            "remote": true,
            "request": "attach",
            "target": ":3333",
            "type": "gdb"
        }
    ],
    "version": "0.2.0"
}
Now you should be able to debug your program by pressing F5. Note that (a) you have to build the
program first (e.g. by pressing Ctrl + Shift + B) and that (b) the debugger will execute your
program right after flashing the device so you'll always need at least one breakpoint.